
THE BENCHMARK NOTEBOOK
BonVoyage benchmarks.
With the context attached.
Useful measurements show where a gateway does well, where it does not, and exactly what was tested. This page leads with evidence bound to public v1.0.4; older campaigns remain available in a separate historical archive.
CAMPAIGN 03 / V1.0.4 / NOVEMBER 1-4, 2026
At 600K, the difference was tail stability.
The post-release replay bound the public v1.0.4 package to its exact binary, matched the TLS, payload, connection intent, upstreams, transformations, client lanes and 24-CPU application allowance, and rotated run order. At the supplemental 600,000 offered-RPS point, both systems returned every measured request successfully. BonVoyage stayed inside the 500 ms p99 gate in all three repetitions; NGINX stayed inside it in one of three.
How the comparison was constructed.
Four separate shared AWS c7a.8xlarge roles isolated traffic generation, the active gateway, deterministic upstreams, and evidence collection. Only one gateway ran on the target at a time. Application work used logical CPUs 8-31, while housekeeping and IRQ work remained on 0-7. The product order rotated between repetitions.
Traffic
Eight client lanes, 30-second warmup and 60-second measured window per run. HTTP/1.1 with a 256-byte upstream response.
Gateway allowance
BonVoyage with 24 reactor shards; NGINX 1.30.4 with 24 workers; each receives the same 24-CPU allowance.
Origins
Two fixed round-robin origins with matched keepalive and timeout intent.
Semantics
Exact request and response set, append and remove outcomes checked before and after every load run. Caching, compression, access logs, request buffering and response buffering disabled.
How to read the CPU number.
Both products received the same 24-CPU allowance: 24 BonVoyage reactor shards or 24 NGINX workers. App CPU is accumulated application CPU-seconds divided by wall time. It reports average compute consumed, not how many workers ran, how many CPUs participated, or how much useful work each CPU completed.
At 480K, both products met the traffic and tail gates, so NGINX consuming less measured application CPU is a valid advantage for that exact operating point. At 600K, NGINX still consumed less application CPU, but two of its three repetitions missed the p99 gate. The lower number therefore cannot establish greater efficiency at that point. This campaign did not profile NGINX scheduler wait, locks, internal queues or per-worker saturation, so it does not claim a root cause for the tail widening.
Why a run was accepted or rejected
Success count alone was not enough. Every accepted run had to satisfy all of these gates:
- Correct status, body, headers, authentication and protocol semantics.
- Zero unexpected client errors, timeouts or semantic failures.
- p95 and p99 each at or below 500 ms; p99.9 is diagnostic only.
- Reconciled request counts and bounded application, host, IRQ, support-role, RSS and descriptor collection.
- No relevant process restart, leak signal, failed recovery or cleanup failure.
- Scheduled repetition successful-RPS variation no greater than 5 percent, without selecting a preferred run.
This is why the two rejected NGINX 600K repetitions are not described as traffic failures: every request succeeded, but p99 crossed the 500 ms acceptance boundary.
Why these load points were used.
Fixed offered rates show how latency and resources change as pressure rises without selecting a convenient peak after the fact. The frozen campaign used 20%, 40%, 60% and 80% of a 600,000-RPS shared-VM envelope. C03 executed 20%, 40% and 80%; its unused 60% point is reported rather than silently filled in. The separate 100% run was added only as a tail diagnostic.
| Point | Offered load | Class | Why it was run | Outcome |
|---|---|---|---|---|
| 20% | 120,000 RPS | Frozen curve | Establish the low-load semantic and repeatability reference. | Accepted: BonVoyage 3/3 and NGINX 3/3. |
| 40% | 240,000 RPS | Frozen curve | Observe the middle of the operating curve before tail pressure. | Accepted: BonVoyage 3/3 and NGINX 3/3. |
| 60% | 360,000 RPS | Frozen curve | Planned intermediate bracket. | Closed unexecuted after 40%, 80% and the supplemental diagnostic bracketed the relevant behavior. |
| 80% | 480,000 RPS | Frozen curve | Test a high fixed rate while retaining stable primary tails. | Accepted: BonVoyage 3/3 and NGINX 3/3. |
| 100% | 600,000 RPS | Supplemental diagnostic | Examine tail stability at the frozen envelope, without calling it capacity. | BonVoyage accepted 3/3; NGINX accepted 1/3 because repetitions 1 and 3 exceeded the p99 gate. |
| Gateway | Successful RPS | Tail-gate passes | p50 | p95 | p99 | App CPU (avg core-eq) | RSS | Descriptors |
|---|---|---|---|---|---|---|---|---|
| BonVoyage | 599,899.2 | 3/3 | 0.786 ms | 2.180 ms | 189.934 ms | 22.66 | 643.2 MiB | 3,930 |
| NGINX | 599,787.9 | 1/3 | 0.731 ms | 256.919 ms | 745.333 ms | 16.92 | 959.0 MiB | 5,242 |
At 480K, both systems were stable and the trade-off was different.
The frozen 80% point is important context for the high-load result. NGINX retained slightly lower primary latency and consumed less measured application CPU. BonVoyage retained materially lower resident memory and fewer descriptors. A fair report needs both observations.
| Gateway | Successful RPS | Tail-gate passes | p50 | p95 | p99 | App CPU (avg core-eq) | RSS | Descriptors |
|---|---|---|---|---|---|---|---|---|
| BonVoyage | 479,929.5 | 3/3 | 0.657 ms | 1.367 ms | 31.709 ms | 22.12 | 601.2 MiB | 3,943 |
| NGINX | 479,930.2 | 3/3 | 0.589 ms | 1.335 ms | 29.711 ms | 13.97 | 956.4 MiB | 5,225 |
The retained runs, replayed through the observability cockpit.
Each view was generated from checksum-verified per-run summaries labeled shared-vm-directional. They make repetition and gate outcomes easier to inspect without replacing the tables or retained evidence authority.
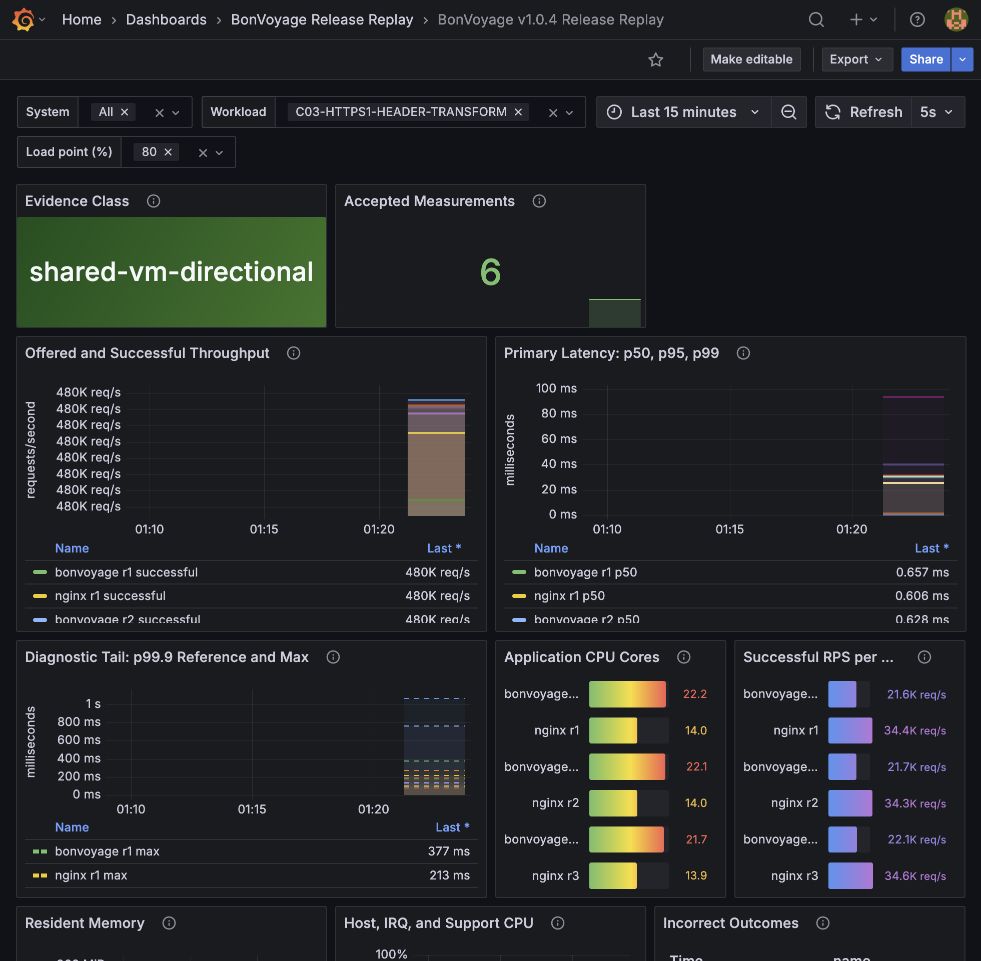
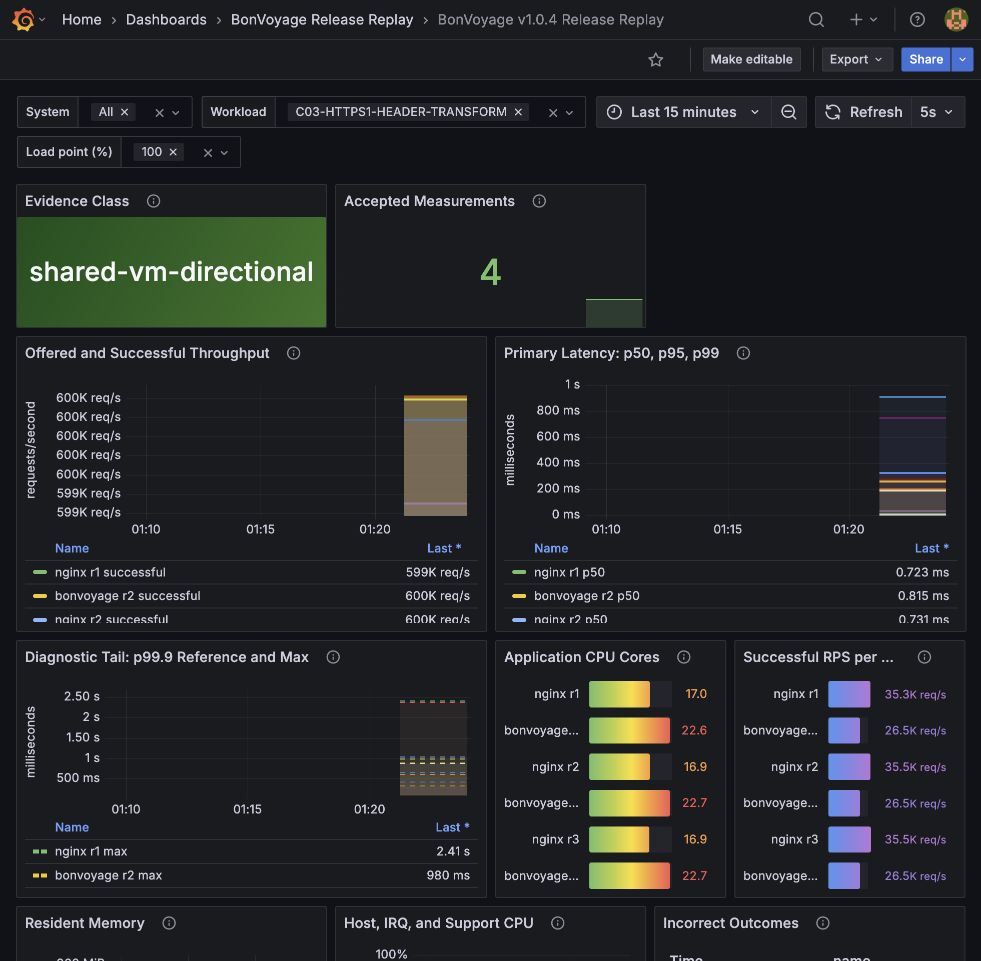
These are local Grafana visualizations of retained AWS result summaries, not live AWS telemetry or raw time-series samples from the original load windows.
What did the actual combined policy chain cost?
D03 measured BonVoyage against its payload-matched control at 24,000 offered RPS. The control established the cost of the same transport and payload without the composed policy path. The policy profile then exercised twelve components together, including RS256 JWT, source-IP admission, CORS, content guards, local admission controls, header transformations, rewrites, retry budget and passive endpoint health. It did not estimate the result by adding separate policy tests.
Expected result: positive traffic had to reach the upstream with the exact transformations, while missing JWT, denied source, invalid content type and preflight cases had to return their exact bounded outcomes. Why it was accepted: All three control and all three combined-policy measurements reconciled, every warmup and measured request succeeded, all six positive and negative semantic cases passed, primary tails stayed inside the gate, and no gateway restart occurred.
| Profile | Successful RPS | p50 | p95 | p99 | App CPU (avg core-eq) | Host CPU | RSS | Descriptors |
|---|---|---|---|---|---|---|---|---|
| Payload-matched control | 23,999.25 | 0.238 ms | 0.300 ms | 0.335 ms | 7.456 | 23.32% | 552.75 MiB | 203 |
| Combined policy | 23,999.21 | 0.285 ms | 0.362 ms | 0.412 ms | 8.119 | 24.30% | 555.19 MiB | 211 |
What outcome can an operator take from this?
Bounded tails under pressure
At the tested 600K diagnostic, BonVoyage kept p99 within the stated service gate in every repetition. The useful outcome is repeatable tail control, not a peak-RPS slogan.
More room inside a memory budget
At 480K and 600K, BonVoyage used materially less resident memory and fewer descriptors in this topology. Teams can evaluate whether that density matters on their own edge or platform nodes.
Policy cost before production
The composed-policy replay makes the latency, CPU and memory increment visible before an operator adopts the path. It replaces an assumption with a bounded measurement.
A decision that can be challenged
Exact artifact identities, setup, gates, accepted runs and rejected attempts make the result reproducible and falsifiable. An engineering team can rerun the contract against its own API and SLO.
Evidence class: Shared-EC2 directional evidence. Shared EC2 does not prove dedicated-host, NUMA or physical-NIC behavior. The 600K point is a supplemental diagnostic outside the frozen 20/40/60/80% curve. p99.9 remains diagnostic; p95 and p99 control the tail gate. The public package is a sanitized derived summary, not the raw evidence authority.
HISTORICAL EVIDENCE / SEPTEMBER 18, 2026
The earlier campaigns remain available, but separate.
The September tables belong to older BonVoyage builds and different test questions. They remain public for transparency and historical comparison, but they are no longer mixed into the v1.0.4 performance story.
Open the historical benchmark archiveWhat we are not claiming.
Not universally faster.
NGINX led several throughput and moderate-load latency profiles and consumed less measured application CPU at several points. A qualified stability result on one workload is not superiority across gateways.
Not an internal NGINX diagnosis.
Lower CPU alongside a missed tail gate is not proof of efficiency, but it also does not identify scheduler stalls, lock contention or queue saturation. Those explanations require separate profiling.
Not your infrastructure savings.
Operating cost depends on policies, payloads, hardware, utilization, migration effort, and your SLOs. Evaluate your actual service.
Historical claims stay historical.
The September campaigns remain bound to their September 18 builds. Only the November replay section is bound to public v1.0.4.
Not maximum capacity.
The replay uses fixed offered rates on shared virtual machines. It records operating and failure boundaries, not a dedicated-host ceiling or production sizing promise.
START WITH ONE SERVICE
Your traffic is the real test.
Bring your workload, your policies, and your latency budget.